Fixing Line Chart Decimals in Chart.js
No ads, no tracking, and no data collection. Enjoy this article? Buy us a ☕.
I've been doing a lot of data visualizations lately for a project at work, and as a result, I've built up a collection of charts and graphs that I've been slowly putting into a tutorial repository on GitHub. So far, I've worked through Flotr2 and Chart.js, and I'll probably add in a few more before tossing some D3 in there for good measure. Also, it helps that the next series of recordings that Bill and I are doing for the podcast will include an episode on data visualization, so it's been a requirement for me to brush up on my skills.
The problem in open source software has always been documentation, especially for projects that aren't corporate sponsored. Even my own project, metron, suffers from this--although I've been working in my off hours to beef up that documentation. Unfortunately, Flotr2 and Chart.js are no exception, with Flotr2 lacking a great deal of documentation beyond the minimal, and Chart.js having prettier documentation, but the look-and-feel is actually deceptive. It's hard to navigate the numerous options, and where those options actually need to go.
One quick example deals with decimals on line charts. For example, take a look at this example:
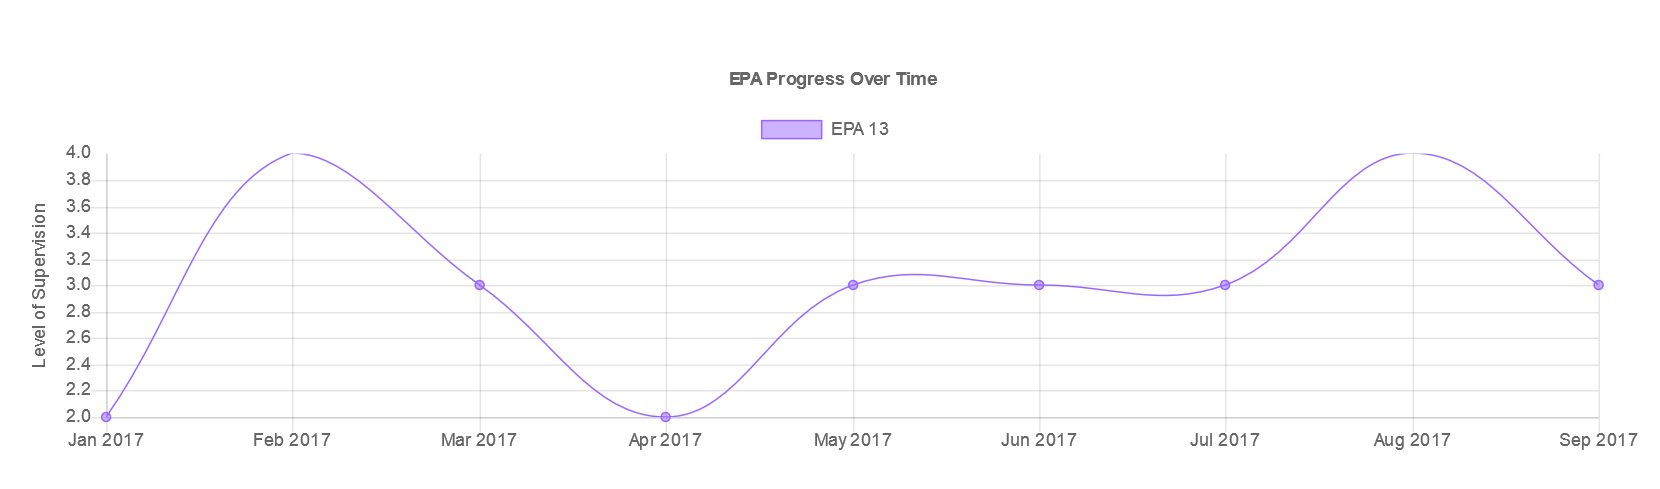
The level of supervision on the y-axis is displaying in decimal. This isn't the desired behavior, so we need to make some adjustments to the Chart.js options.
var options = {
          scales: {
              yAxes: [
                  {
                      ticks: {
                          min: 0
                          ,max: 5
                          ,callback: function(val) {
                              if(val == 0 || val == 5) {
                                  return null;
                              }
                              return Number.isInteger(val) ? val : null;
                          }
                      }
                  }
              ]
          }
      };
In some versions and browsers (and depending on the data), the min and max values might be enough to suppress the decimals; however, it might be necessary to use the callback option for better granular control. In this example, I don't want 0 or 5 to display on the line chart because no data will be marked at those points, but I want the additional lines for display purposes. As a result, if the val variable (which is the y-axis data) is 0 or 5, we return null. If not, we check if val is an integer instead of a floating point decimal. If it is, we return the value. If not, we return null.
This will result in a line chart that looks like this:
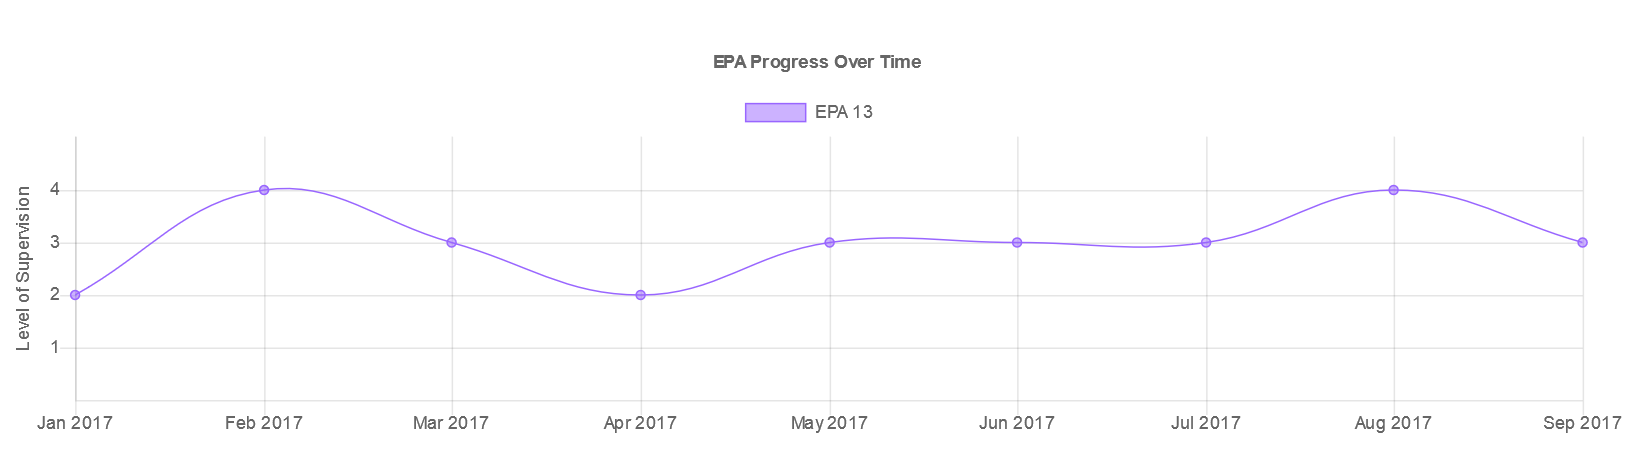
As a caveat, Internet Explorer 11 doesn't support isInteger(), so you can either create your own function that checks for the availability of this method, or wrap you code in a try/catch block. You could then process the val as a string in the catch block to return null for values that contain a decimal. Most programmers frown on putting business logic in catch blocks, so the former is a better option.